This topic is going to be somewhat more technical than usual. Â It involves some inside baseball, to mix sports metaphors, so if the nitty gritty details of FIS point calculations don’t strike you as an exciting page turner, you’ve been warned! Â However, if you stick with me, you’ll learn how brutally stupid FIS’s F-factor adjustments actually are. Â Yes, I said brutally stupid.
First we need some background. Â (But for real, if you’re a serious ski racer, you should know this stuff! Â It’s your sport, educate yourself!)
FIS points are a system devised to (fairly) compare ski racing performances across different races. Â Now, you might say “Why can’t we just say, ‘I finished 5th!'” and be done with it? Â Well, that approach has some serious problems. Â Anyone who has participated in more than one ski race can tell you that there’s a huge difference between finishing 5th in a weak field and being 1.5 minutes out of first, versus finishing 5th among a very strong field and only 10 seconds out of first.
These two 5th place finishes represent very different performances. Â But if all we say is that each racer finished 5th, we’d be fooled into thinking they were about the same. Â FIS points are an attempt to remedy this problem. Â It solves the “time behind the winner” problem by using percent back from the winning time. Â It solves the weak field vs. strong field problem using race penalties.
The basic idea is that for a particular race, we calculate the percent back (PB) from the winning time for each skier. Â The winning skier’s percent back is zero, and so on. Â Then we calculate a race penalty that measures the overall strength of the competition on that day. Â It’s based on the top five skiers (generally), and this penalty is added to everyone’s percent back.
For the purposes of this article, we can ignore the race penalty issue.  I’m only considering top international racing (World Cup, World Championship and Olympics) where the race penalties are, by definition, zero.  The presumption is that the skiers at any of these races represent the toughest field in the world at any given time.  [1. This isn’t exactly true of course.  But the variation in field strength among WC races is far less than between, say, a WC race and a local high school race.]
Here’s a simple example. Â Suppose we have a World Cup race and the top three skiers and times are:
- Skier A Â 26:58.07
- Skier B Â 27:10.19
- Skier C Â 27:13.88
We convert each time into seconds and find the PB from the winning time:
- Skier A Â 1618.07 Â 0.00%
- Skier B Â 1630.19 Â 0.75%
- Skier C Â 1633.88 Â 0.98%
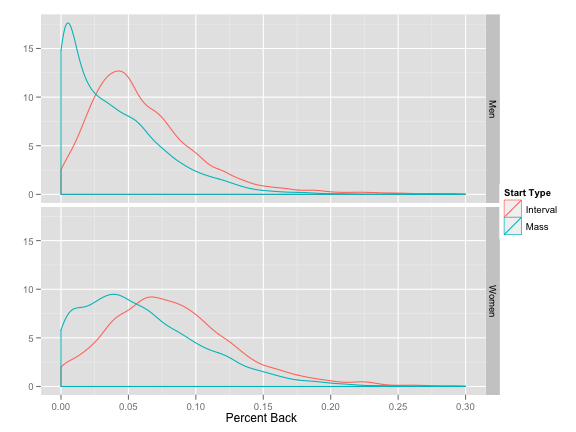
We could just stop here and use only PB.  Sadly, it quickly becomes apparent that different types of races can produce dramatically different PB scores.  The following graph shows the distribution of PB for  men and women, comparing interval and mass start races.  Only races since 2002-2003 are included. (Pursuits with no breaks are included in the mass starts.)

Clearly, mass start races lead to many more low PB values than interval start races. Â Why is this a problem? Â Well, the advantage of using PB is that it is supposed to generalize better across different races. Â That is, if I say I finished 2.5% back in one race and 5% back in another, we ought to be able to conclude that the first performance was “better” even though they took place in completely different races.
But if my 2.5% back race was in a mass start, that is somehow “less impressive”, since evidently many more people are able to ski close to the winner in a mass start race. Â It is suddenly less clear which is the better race, 2.5% back in a mass start or 5% in an interval start race.
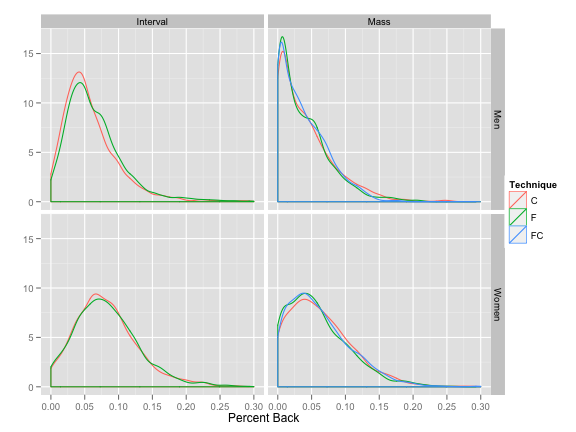
Just to be on the safe side, let’s check if there are similar discrepancies between classic and freestyle races:

The FC category refers to pursuit races where the skiers use both techniques during the course of a mass start race. Â This looks more or less ok. Â Technique doesn’t seem to be creating inherently different PB’s.
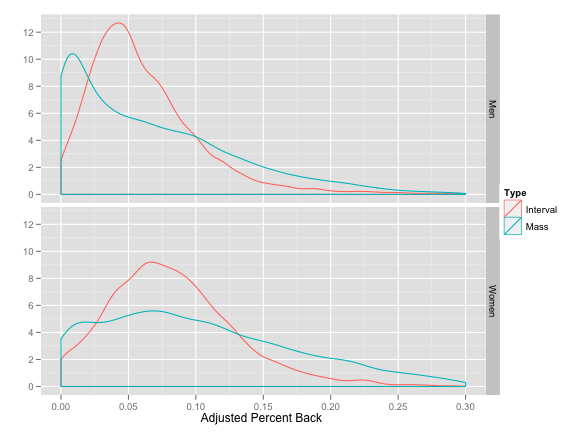
That leaves the problem of interval vs. mass start races. Â This is the problem that F-factors are meant to “solve”. Â What FIS does is to simply scale the PB values from mass start (and pursuit) races up by a factor of 1.75. [2. Actually, they multiply interval start races by 800 and mass starts by 1400, which is the same as multiplying them by 800/800=1 and 1400/800=1.75] Â Let’s look at what that achieves:

Wait a minute.  Wasn’t the F-factor supposed to make these two distributions look the same?  That’s how I’d describe a solution to this problem, but I’m betting no one as FIS thought about it very hard.  The thought process was probably just, “Mass start points are too low.  Let’s make them bigger.”  Facepalm.
They succeeded in making them bigger, but haven’t solved the original problem, which was that PB’s from mass start and interval starts meant somewhat different things. Â Now we have two discrepancies: notice that the mass start curve is higher than the interval start curve in two places! Â Mass start races are now more likely to produce really low PB’s and really high PB’s.
This means that if you’re in the bottom third or so of a mass start race, your points are actually considerably worse thanks to this adjustment.  Not only have we not fixed the problem (top finishers in mass start races are still getting better points) but we’ve actually made the problem dramatically worse for everyone else.  If you’re not in the top 25-30 in a mass start race, you’re are being royally screwed, my friend!  Royally.
Now that we’ve set up the problem, on Wednesday I’ll discuss whether we should really worry about this at all and if we do decide to worry about it, I’ll introduce a simple fix.
[ad#AdSenseBanner]
{ 1 } Comments