I’ll be the first to admit that sprinting doesn’t get as much love here at Statistical Skier. Â To be honest, that’s probably my subconscious at work, as I have a stronger connection to distance events I suppose. Â But it’s not terribly fair, so here is some World Cup sprint qualification analysis for all you sprint lovers out there.
The first step to success in sprinting is qualifying for the elimination rounds.[1. Everyone skis the course one at a time, i.e. the qualification round, and then the top 30 move on to elimination heats of 6 at a time or so.] Â So I thought it might be fun to look at what sorts of efforts it takes to qualify in a World Cup sprint race (and any trends or patterns that might arise).
We’re going to do this using two measures: percent back and pace (seconds/km). Â Using pace means we’re implicitly assuming that the courses are measured accurately, which probably has not always been the case. Â Just for starters, the skier’s times are measured to the tenth of a second, but the length of the courses is typically only reported to the nearest 100m. Â And it takes a bit more than a few tenths of a second to ski 100m. Â Also, we should keep in mind that there can be pretty extreme variations in course design and weather/snow conditions. Â So keeping all that in mind, let’s dive in…
First off, let’s grab the top ten qualifiers (i.e. the top ten in the qualification round) and look at what sorts of speeds they manage:
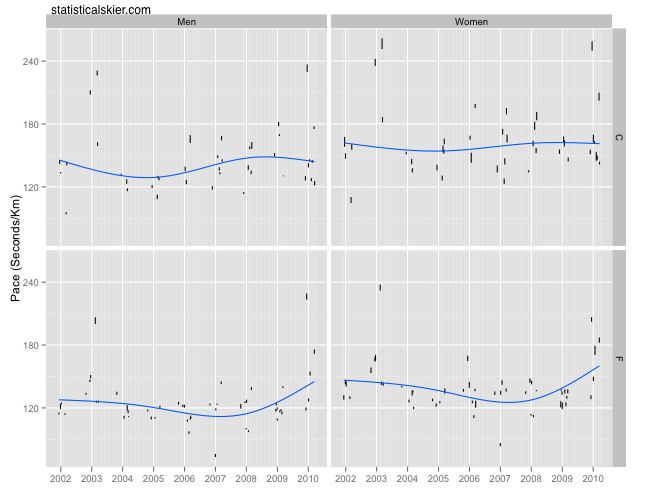 Rather than plot each value as a separate dot, I’ve plotted the values for each individual race as a vertical bar. Â This gives us some sense of how variable the efforts of the top ten qualifiers can be. Â Usually they are quite close (very short bar) but occasionally they’re more spread out (longer bars).
There are a couple of things to note about these data. Â For the most part, the average pace seems fairly consistent over time. Â The obvious exception are the freestyle, or skating, sprints last season. Â Personally, I think the sudden uptick of the trend lines in the freestyle panels is mostly due to there being relatively few freestyle sprints last season, a few of which happened to be quite slow just by chance combined with the fact that trend lines are often a bit more sensitive to data near the end points (despite my best efforts).
So I’d say the men are averaging around 2:00 minutes/km in freestyle sprints, maybe 2:20 min/km in classic sprints while the women are averaging ~2:20 min/km in freestyle sprints and ~2:35 min/km in classic sprints. Â But as you can see, there’s quite a bit of variation race to race. Â To my eye, it seems like there may be more variability in the classic sprints than the skating.
Another thing to note is that for some reason, the 2002-2003 season saw several slow sprint races across the board. Â My best guess in this case is that there were some races in unusual weather/snow conditions that season, which is why it seemed to happen to both the men and the women.
Since the top thirty move on to the elimination rounds, let’s take a look at the data on the 30th skier in the qualification round, which serves as our cutoff for moving on.
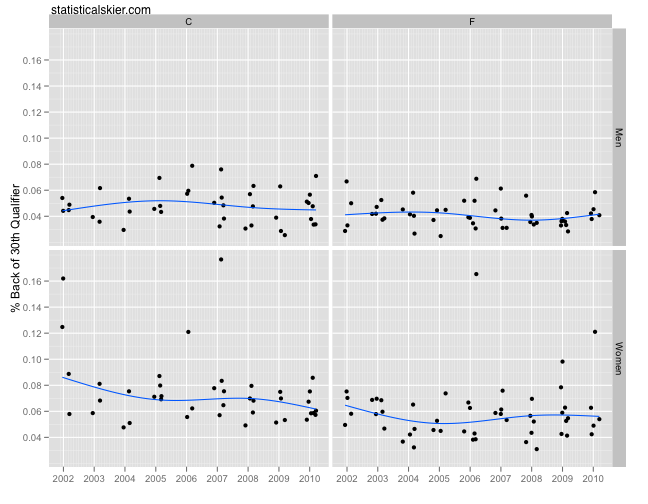 Again, these values seem pretty stable over time, with perhaps a slight decline in the women’s classic sprints (but again we have unusual data at the endpoints messing with things). Â As with all data, we need to comment on the unusual stuff. Â In this case, there are six women’s races where the 30th place qualifier was considerably further behind the 1st qualifier than would seem typical. Â Generally, this means that, for whatever reason, the field was somewhat weak that day. Â Let’s see if omitting these six points changes the way the data look:
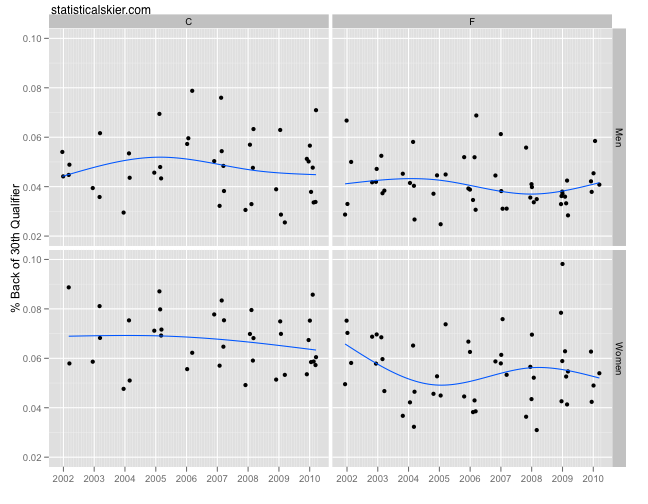 This suggests that the 30th place qualifier is typically around 5% back in a men’s classic sprint and ~4% back in a men’s freestyle race, while the values for the women are ~7% and ~5.5% respectively.
Honestly, I’m puzzled at the difference between classic and freestyle sprints here. Â Using percent back ought to account for the generally higher rate of speed in skating. Â On its face, this would suggest that there is a slightly bigger gap between the best and 30th best classic sprinter than between the best and 30th best freestyle sprinter on the World Cup, for both men and women. Â Here’s a look at the same data that gives a clearer picture of the difference I’m talking about:
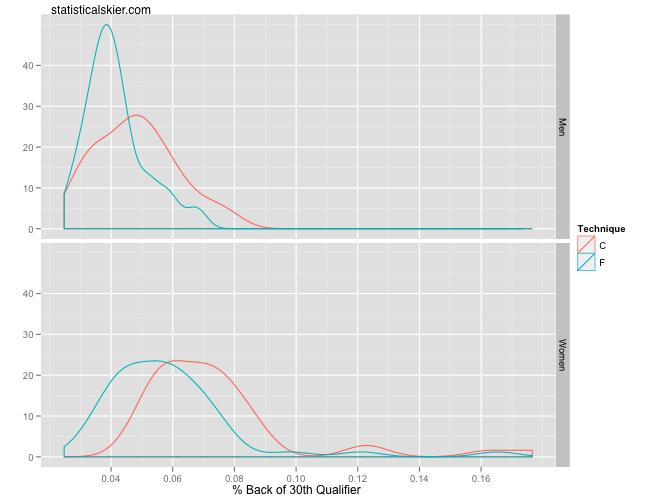 And yes, I double checked by calculating a quick confidence interval for the differences. Â And while the difference between the two pairs of distributions is small, it is statistically significant.[2. And no, I didn’t use a t-test, since I’m dubious of the normality condition and certainly the equal variances condition for the men. Â As always, bootstrapping to the rescue.]
In any case, I’m not sure why this would be. Â Feel free to speculate…
Let’s wrap this up with a look at how fast the 30th place qualifiers are going in an absolute sense, rather than in percent back:
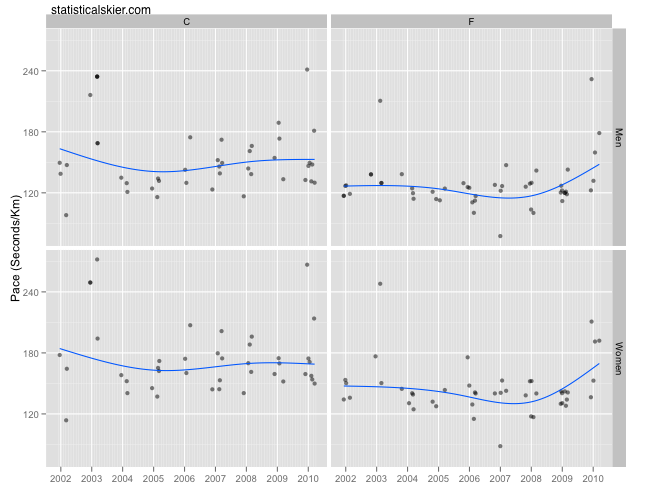 Unsurprisingly, this mirrors the analogous plots for the top ten qualifiers above, just a tad slower.
So if you can, find a really challenging sprint course and ski it as hard as you can. Â How close to these sorts of paces can you get?
[ad#AdSenseBanner]
{ 1 } Comments