National Team Selection & Age
Springtime means national team nominations, which is always one of people’s favorite things to argue about. This has become particularly true in recent years with some national teams having a fairly explicit preference for younger skiers built into their criteria. It seems like every year there are 1-2 skiers pushing 30 (or beyond) that have skied well that season but are passed over for younger competitors who have equal or even worse results to boast of.
National team selections, along with Olympic and World Championship team selections, are delicate and fraught decisions, and so I try to write very carefully on the topic. So be prepared for lots of qualifications and caveats. If you wanted a straight answer, you shouldn’t have asked a statistician!
One of the first problems with looking at patterns between age and international skiing success is defining “success”. Is it podium results? Top 10? Scoring World Cup points? Is it doing any of those repeatedly, and if so, how many times? This is the first subjective decision point in this ostensibly objective exercise.
For the purposes of this post I’m going to go with success being a top ten result in a distance race (WC/OWG/WSC/TdS) or a making a sprint final (top 6). Why? Because this is my blog and so I get to do whatever I want. Let’s start with some simple descriptive stuff. At what age to skiers tend to achieve these things?
Starting with distance:
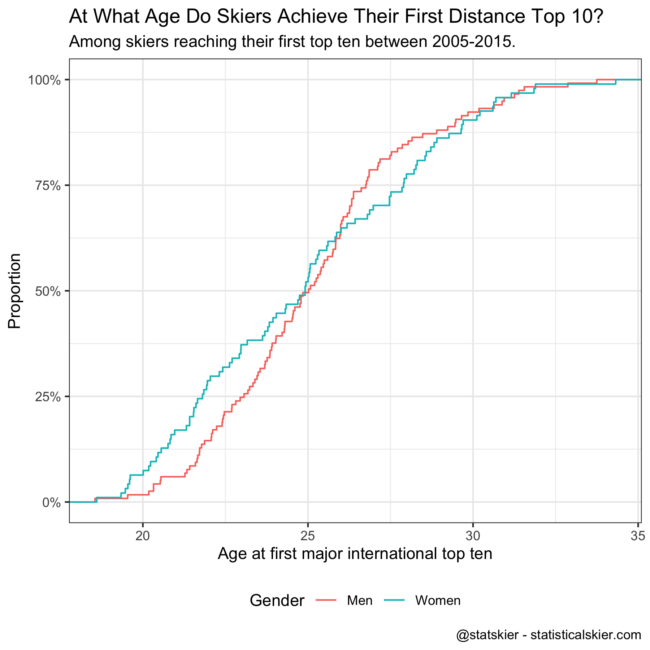
The way to read this is to start on the y-axis and move horizontally across. So start at 50% and move across to see that around 50% have gotten their first top 10 distance result by the age of 25. 75% of men have gotten their first top 10 by around age 26 and women closer to 28. Another way to put this is that “only” around 25% of people with a top ten distance result manage to do that for the first time past age 26-28.
Now, 25% is a minority, but you might also say it’s a pretty big minority. Big enough that it isn’t really surprising when it does happen. (Does this kind of language feel familiar to certain probabilistic forecasts of a certain US presidential election?)
Before we get into more technicalities and caveats, lets look at the same thing for sprinting:
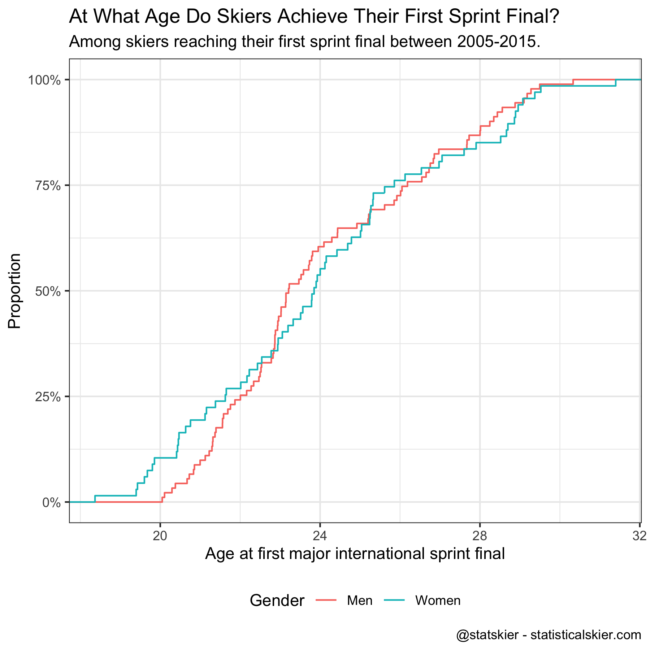
These curves are pretty similar, maybe shifted back by a year or two. So here around 50% of skiers have their first sprint final by age 23-24 and around 75% have achieved that by around age 26.
An interesting thing to think about with this data is what direction the causation (if any) is going in. Or more precisely, what specifically is it about being 25-30 that makes it harder to land a strong result? Do older skiers have an inherently lower ceiling on their future improvement? Or are there structural barriers that give them fewer opportunities to improve?
It is certainly true (or at least plausible) that on average your potential to improve decreases as you age. I mean, I’m 41; trust me, getting older is a thing. But what if because everyone “knows” that older skiers have a lower ceiling they are subtly but systematically given fewer opportunities that artificially contributes to their lack of success?
I’m not trying to be inflammatory here. Consider the case of Martin Johnsrud Sundby, who was left off the Norwegian national team this year. Norway probably could field a pretty darn competitive national team comprised entirely of skiers over the age of 27-28, at least from the perspective of us in North America. But in an environment filled with talented skiers under 23 (again, compared to North America) why on earth would you?
So what if this pattern toward success at an early age is being driven by the hyper-competitive environments of Norway, Russia, Sweden, etc. where if you haven’t had World Cup success by age 24 there are 5-10 more super talented 22 year olds biting at your heels for a chance?
The problem with this is that if you’re looking for a data set of skiers who have plugged away at competing on the World Cup at a middling level for a long time to see how many of them suddenly get much better past age 28, that is a very small and peculiar set of skiers. Hard to do “unbiased” analysis on those folks. (I mean, I have looked at it, and these folks really do rarely improve, but it’s such an oddball group of skiers I’d hesitate to generalize much from them.)
Now that I’ve pummeled you with that barrage of caveats, let’s actually look at what really does happen after a skier’s first top 10 distance result or their first sprint final. First up, distance:
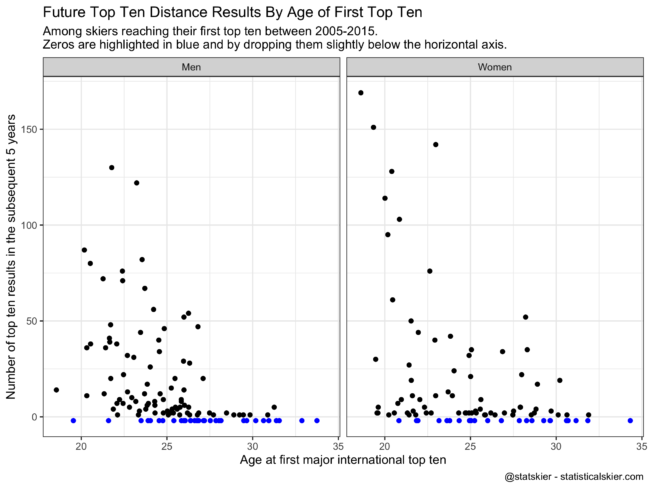
For people who got their first top 10 WC/OWG/WSC/TdS result between 2005-2015, this shows the number of subsequent top 10s they had over the next five years. The points at the bottom get pretty crowded (and I didn’t want to make you think about a log scale) so I’ve highlighted all the 0’s by coloring them blue and dropping them down slightly. So the blue dots are people who were one and done.
So this is why things look pretty grim for older skiers, particularly men. Look at that drop off for the men at age 26-27! The women have a handful of folks who developed into regular top 10 skiers past age 25, but they are a distinct minority. Next up, sprinting:
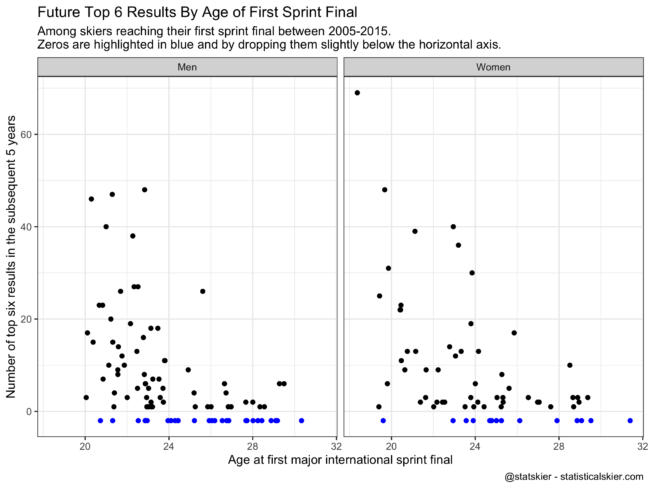
More or less the same story, but shifted 1-2 years younger.
Again, one of the things I worry about when I look at plots like these is what I was rambling on about before. How much of this pattern isn’t because skiers can’t improve dramatically after the age of 25, but instead that so many hyper-competitive skiing nations can afford to be really brutal about tossing them aside because they have a seemingly endless supply of talented 22 year olds right behind them?
Like everything else, it’s probably not one or the other, but a mix of both. This is where we start to incorporate other sources of information. For example, I’m not an exercise physiologist but I can imagine evidence from that field either in support of or against skiers having a lower ceiling past age 25 that is independent of race result patterns. Also, coaches will typically have knowledge about a specific athlete that isn’t captured by knowledge about the “average athlete”. This can be a dangerous source of information, but it is real and valuable. But now we’ve strayed past what could reasonably be encoded into a concrete national team selection criteria.
Don’t say I didn’t warn you! Ask a statistician and you’ll likely get a lot of graphs and data that mostly lead to more questions.